Chart UIBB in Floor Plan Manager (FPM) is implemented using Web Dynpro component FPM_CHART_UIBB. To implement chart component you need to first create a feeder class which implements interface IF_FPM_GUIBB_CHART. Actual display of chart including dimensions, measure, chart type etc is configured using FPM configuration editor (Flexible User Interface Designer).
In this blog I will show you how to create feeder class for chart UIBB, define FPM_CHART_UIBB configuration and then make a FPM Application using FPM_OVP_CONFIGURATION.
Model
I will be using SFLIGHT table as model to display in chart. There is a table type WD_SFLIGHT_TAB defined in dictionary which I will be using to define internal table to hold data in class. You don’t have to use dictionary objects, you can define local types in feeder class and use that if you like.
Feeder Class
Define class ZCL_CHARTUIBB_FLIGHT_MODEL in SE24.

Add interface IF_FPM_GUIBB_CHART in interface tab of class. Interface IF_FPM_GUIBB will be inserted automatically.

Go to ‘Attributes’ tab, define internal table MT_DATA which will hold data at runtime.

We need to re-implement all methods that are added from interface into this class. Go to ‘Methods’ tab and double click on first method IF_FPM_GUIBB_CHART~FLUSH and then press save on next screen. Repeat this for all methods in class.

Code for method IF_FPM_GUIBB_CHART~GET_DEFINITION
METHOD if_fpm_guibb_chart~get_definition.

    DATA: lo_table_descr TYPE REF TO cl_abap_tabledescr,
          lo_table_model TYPE REF TO if_fpm_chart_table_model.

*--------------------------------------------------------------------*
*   Describe model using RTTI class
*--------------------------------------------------------------------*
    lo_table_descr ?= cl_abap_tabledescr=>describe_by_data( me->mt_data ).

*--------------------------------------------------------------------*
*   Pass this model information
*--------------------------------------------------------------------*
    lo_table_model = io_chart_model->get_table_model( ) .
    lo_table_model->set_definition(
                             EXPORTING
                                io_field_catalog = lo_table_descr ).
*                               it_field_description = lt_field_descr
*                               it_special_groups    = lt_sp_group  ).

  ENDMETHOD.
Code for method IF_FPM_GUIBB_CHART~GET_DATA
  METHOD if_fpm_guibb_chart~get_data.

    DATA : lo_chart_table_data TYPE REF TO if_fpm_chart_table_data .

    IF me->mt_data IS INITIAL .
      SELECT *
        INTO TABLE me->mt_data
        FROM sflight .
    ENDIF.

    lo_chart_table_data = io_chart_data->get_table_model( ) .
    lo_chart_table_data->set_data( EXPORTING
                                      it_data = me->mt_data )  .

  ENDMETHOD.
Save and Activate class ZCL_CHARTUIBB_FLIGHT_MODEL
FPM Configuration
I am going to use Application Configuration Tool to create application for FPM_OVP_COMPONENT, then its application configuration and configuration for FPM_CHART_UIBB.
To summarise we require 4 objects
1. Web Dynpro Application for FPM_OVP_COMPONENT
1.a. Configuration for Web Dynpro Application
2. FPM Configuration for FPM_OVP_COMPONENT
3.Configuration for FPM_CHART_UIBB
Run transaction FPM_UB, this will open FPM Workbench Tools. Select ‘Wizard for Creating Empty FPM Application’ from list.

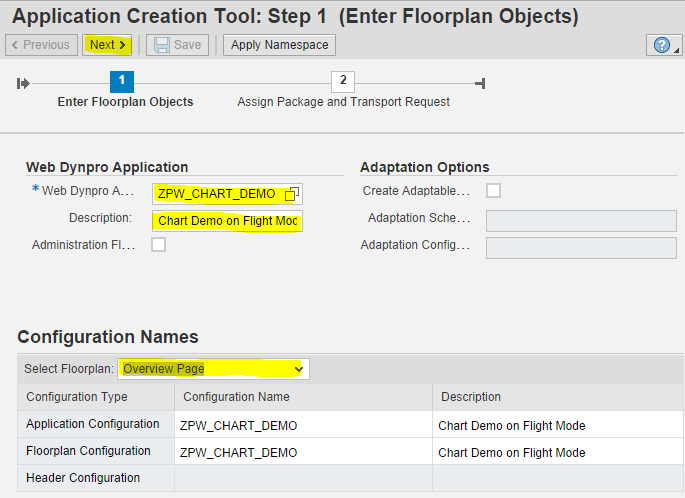
On next screen specify Web Dynpro application name, description and select floorplan ‘Overview Page’. System will propose name for Application configuration and Floorplan configuration name which if you like can change.

Press ‘Next’ button and on next screen specify package (or local object) to save these objects. System should come back with success message with option to ‘Edit Configuration (FLUID)’ and ‘Execute Application.

Before we can execute we need to configure application. Click on ‘Edit Configuration (FLUID)’

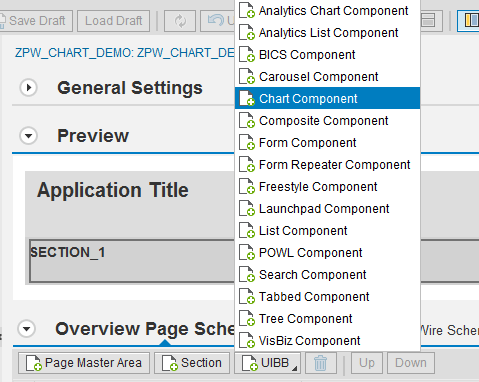
Click on UIBB button and select ‘Chart Component’ to insert chart component in SECTION_1.

You will see an UIBB under SECTION_1 with component name FPM_CHART_UIBB. Fill in configuration name under config ID input and press enter. System will complain that configuration does not exist.

In next few step we will create this configuration for FPM_CHART_UIBB. System will prompt you to specify description. Click on ‘Configure UIBB’.
Chart UIBB configuration

Specify description press OK, save this configuration and press confirm on next dialog specify feeder class which we created earlier press enter.

Then press OK on next dialog.

In General Setting select ‘Stacked Column’ in Chart type and input ‘Max Seats Offered by Airline’ in Title text. Check ‘Title Text Visible’.

Now go to ‘Chart UIBB Schema’ and using button Elements add fields SEATMAX, SEATMAX_B, SEATMAX_F and CARRID. Save this configuration.

Test Application.
You can go back to ACT screen to test this application or you can find Web Dynpro application ZPW_CHART_DEMO in SE80 and test from there.


In legend field names are coming as we haven’t filled fieldcatelog in method IF_FPM_GUIBB_CHART~GET_DEFINITION. I am now going to fill these fields in fieldcatelog and after this description will appear.
  METHOD if_fpm_guibb_chart~get_definition.

    DEFINE _insert_field.
      clear ls_field_descr .
      ls_field_descr-name     = &1.
      ls_field_descr-text     = &2.
      APPEND ls_field_descr TO lt_field_descr.
    END-OF-DEFINITION.


    DATA: lo_table_descr TYPE REF TO cl_abap_tabledescr,
          lo_table_model TYPE REF TO if_fpm_chart_table_model.

    DATA  : lt_field_descr TYPE    fpmgb_t_chartfield_descr,
            ls_field_descr TYPE    fpmgb_s_chartfield_descr.

*--------------------------------------------------------------------*
*   Describe model using RTTI class
*--------------------------------------------------------------------*
    lo_table_descr ?= cl_abap_tabledescr=>describe_by_data( me->mt_data ).

*--------------------------------------------------------------------*
*   Fill Description in Fieldcatelog
*--------------------------------------------------------------------*
    _insert_field 'CARRID'     'Airline' .
    _insert_field 'SEATSMAX'   'Economy class' .
    _insert_field 'SEATSMAX_B' 'Business class' .
    _insert_field 'SEATSMAX_F' 'First class' .

*--------------------------------------------------------------------*
*   Pass this model information
*--------------------------------------------------------------------*
    lo_table_model = io_chart_model->get_table_model( ) .
    lo_table_model->set_definition(
                             EXPORTING
                                io_field_catalog = lo_table_descr
                                it_field_description = lt_field_descr ) .
*                               it_special_groups    = lt_sp_group  ).

  ENDMETHOD.
It looks cool now.

I have tried same , but on output screen chart doesn’t open. It keeps on showing loading screen.
Even i faced the same issue. In the system go to Tx- SICF and try to navigate: default_host->sap->public->bc and try to activate service ui5_ui5 under this and then try to run chart uibb application. Hope this will resolve this issue.